Non-profit/Edu expert and HR head at Kanbanchi with over a decade experience 

Search for a productivity dashboard, and you get two different things back, which is why so many people end up building the wrong one.
A visual dashboard shows you the state of the work. Who has what, what is stuck, what ships this week. You read it in three seconds, and it stays accurate because the people doing the work update it as a side effect of doing the work.
A metrics dashboard shows you numbers about the work. Tasks completed, time logged, throughput by month. You read it in a meeting, and it is accurate only if somebody remembered to update the source.
Most people asking for a productivity dashboard want the first one. They go looking for the second, spend a weekend building a spreadsheet, and by Wednesday it is out of date.
Below are ten board layouts for the first kind, grouped by what you are trying to see. Each one is a working template you can copy and start using, and there is a short section further down on adding the numbers once the visual half is running.
One note on names. If you used Kanbanchi some years ago, you will remember boards being called dashboards. The name changed, the thing did not. Everything below is a board, and a board is the visual kind of dashboard.
What Belongs on a Productivity Dashboard
Five things. Every dashboard that stopped getting used had a sixth.
- What is in progress right now, and who owns each item.
- What is blocked, marked so it is visible without reading anything.
- What is due this week, kept separate from what is due eventually.
- What is waiting on somebody outside the team. This is the category most boards leave out, and the one most delays live in.
- What finished recently, because a board with no visible completions reads like a board where nothing happens.
If a piece of information will not change the next decision somebody makes, it belongs in a report rather than on the dashboard.
All ten templates below are available inside Kanbanchi. Boards are stored as files in your Google Drive, so copying one puts it where the rest of your team’s files already are, with the same sharing permissions.
Create a trial account to check templates
Start Here: Three General-Purpose Boards
If you are not sure which template you need, it is one of these three. They cover most work that is not tied to a specific industry.
Classic Kanban Template
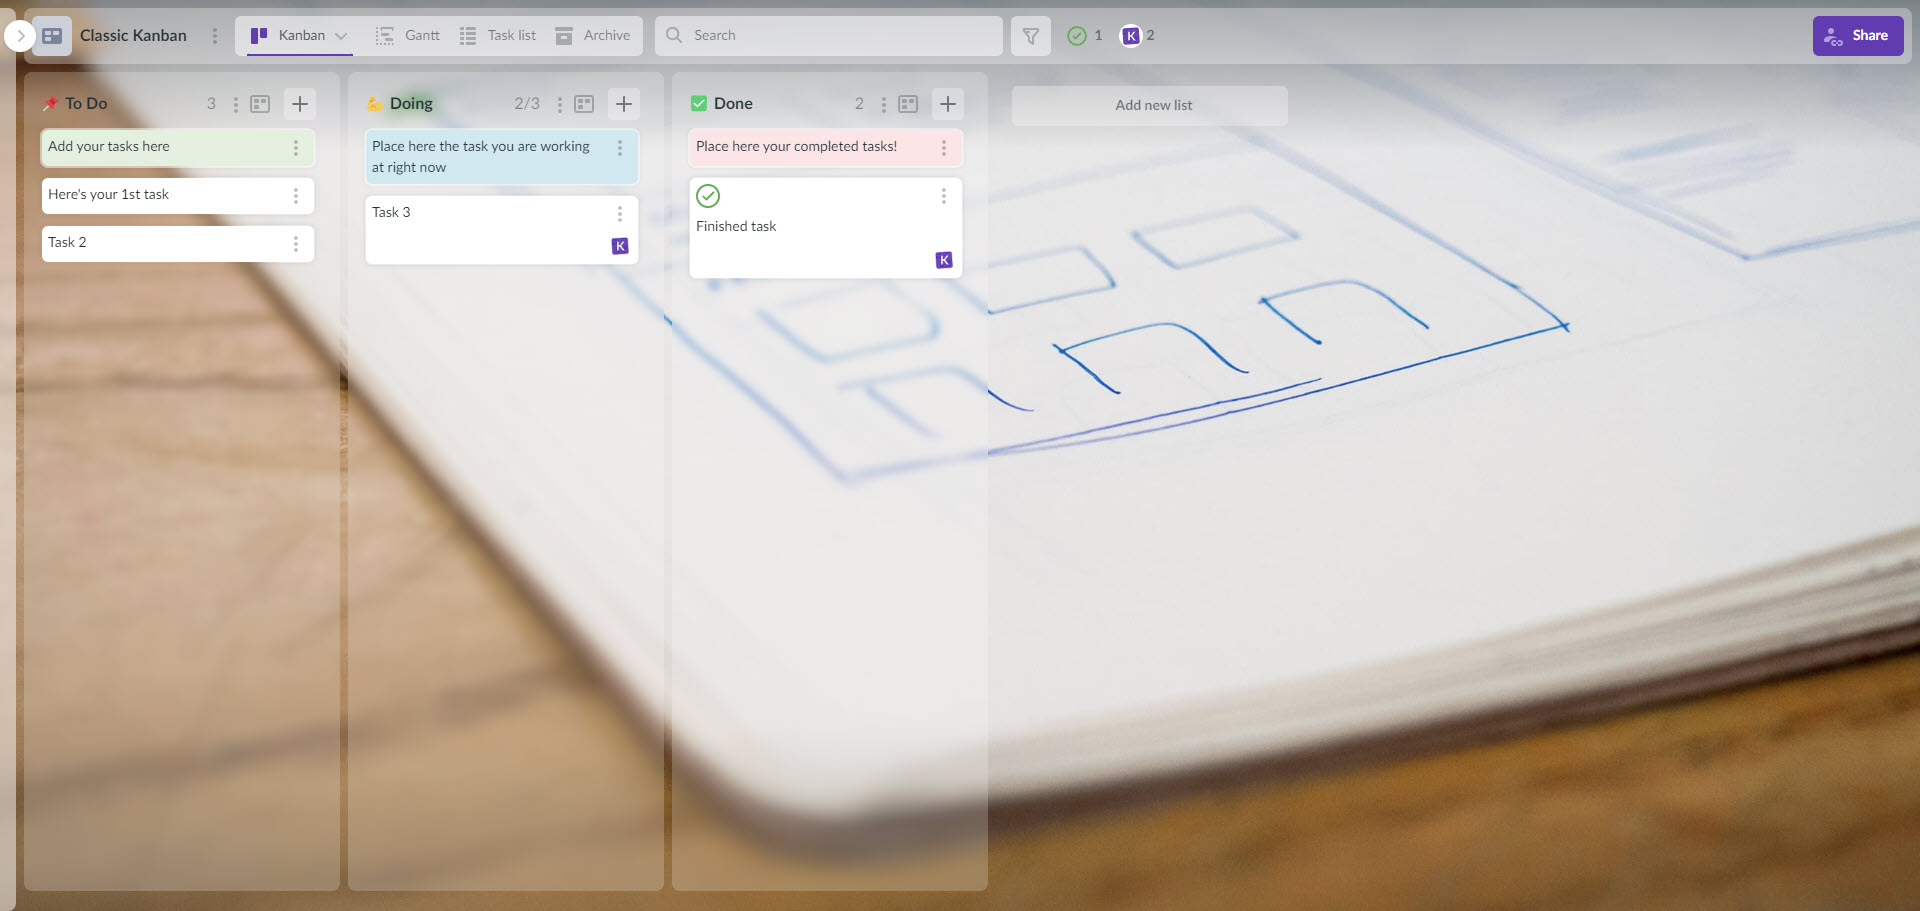
Three lists: To Do, Doing, Done. This is the essential Kanban board, and it reflects the Getting Things Done principle that work should exist in exactly one of three states.
It is the right starting point for almost everyone, and the reason is that its constraint is the useful part. When a task can only be in one of three places, “sort of started” stops being an option. Moving cards left to right is the whole mechanism, and after a week the pile-up tells you where your process actually breaks.
Start here if you have never used a board before. You can add lists later, and most teams do, but they add them because they hit a real problem rather than because a template suggested it.
Kanban with Priorities
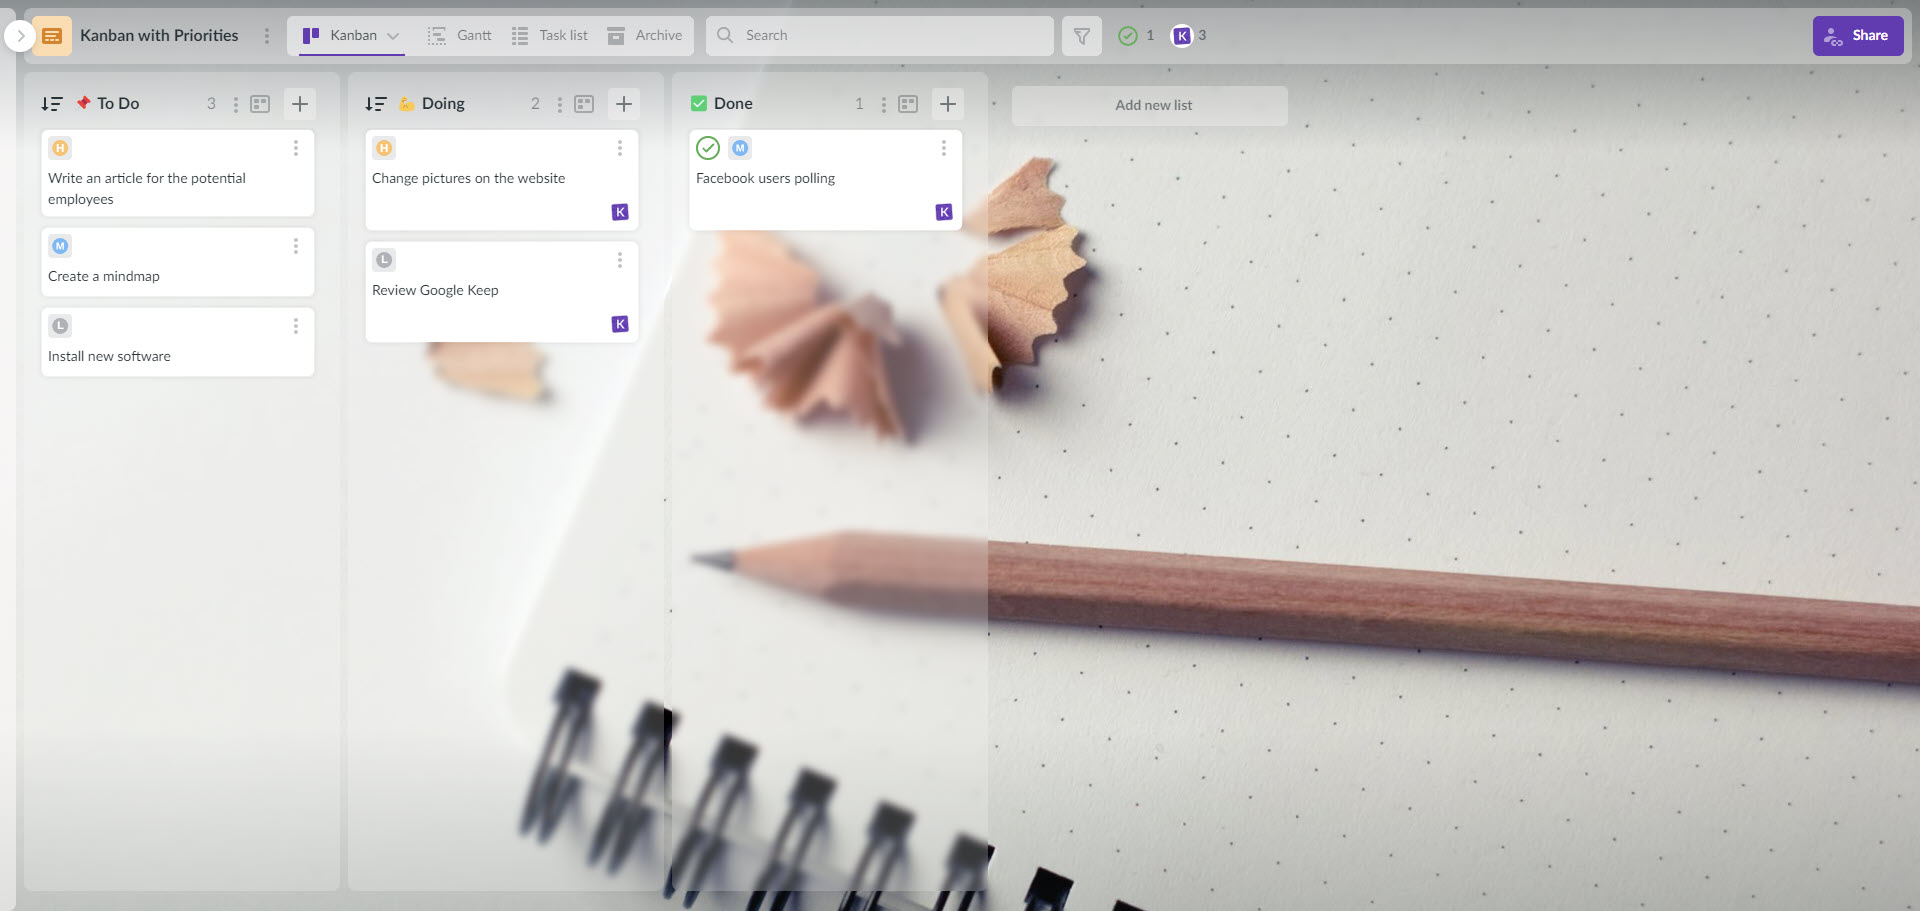
The classic three-list workflow with a priority dimension layered on top, so you control the flow of work and also know which item to pick up next.
The reason this is a separate template rather than a setting is that priority and stage answer different questions. A stage tells you where something is. A priority tells you whether to touch it today. Teams that only track stage end up working on whatever is nearest the top of the list, which is usually whatever was added most recently.
Use this once the classic board has more than about fifteen cards in To Do. Below that, priority is a solution to a problem you do not have yet.
5-Things Concept
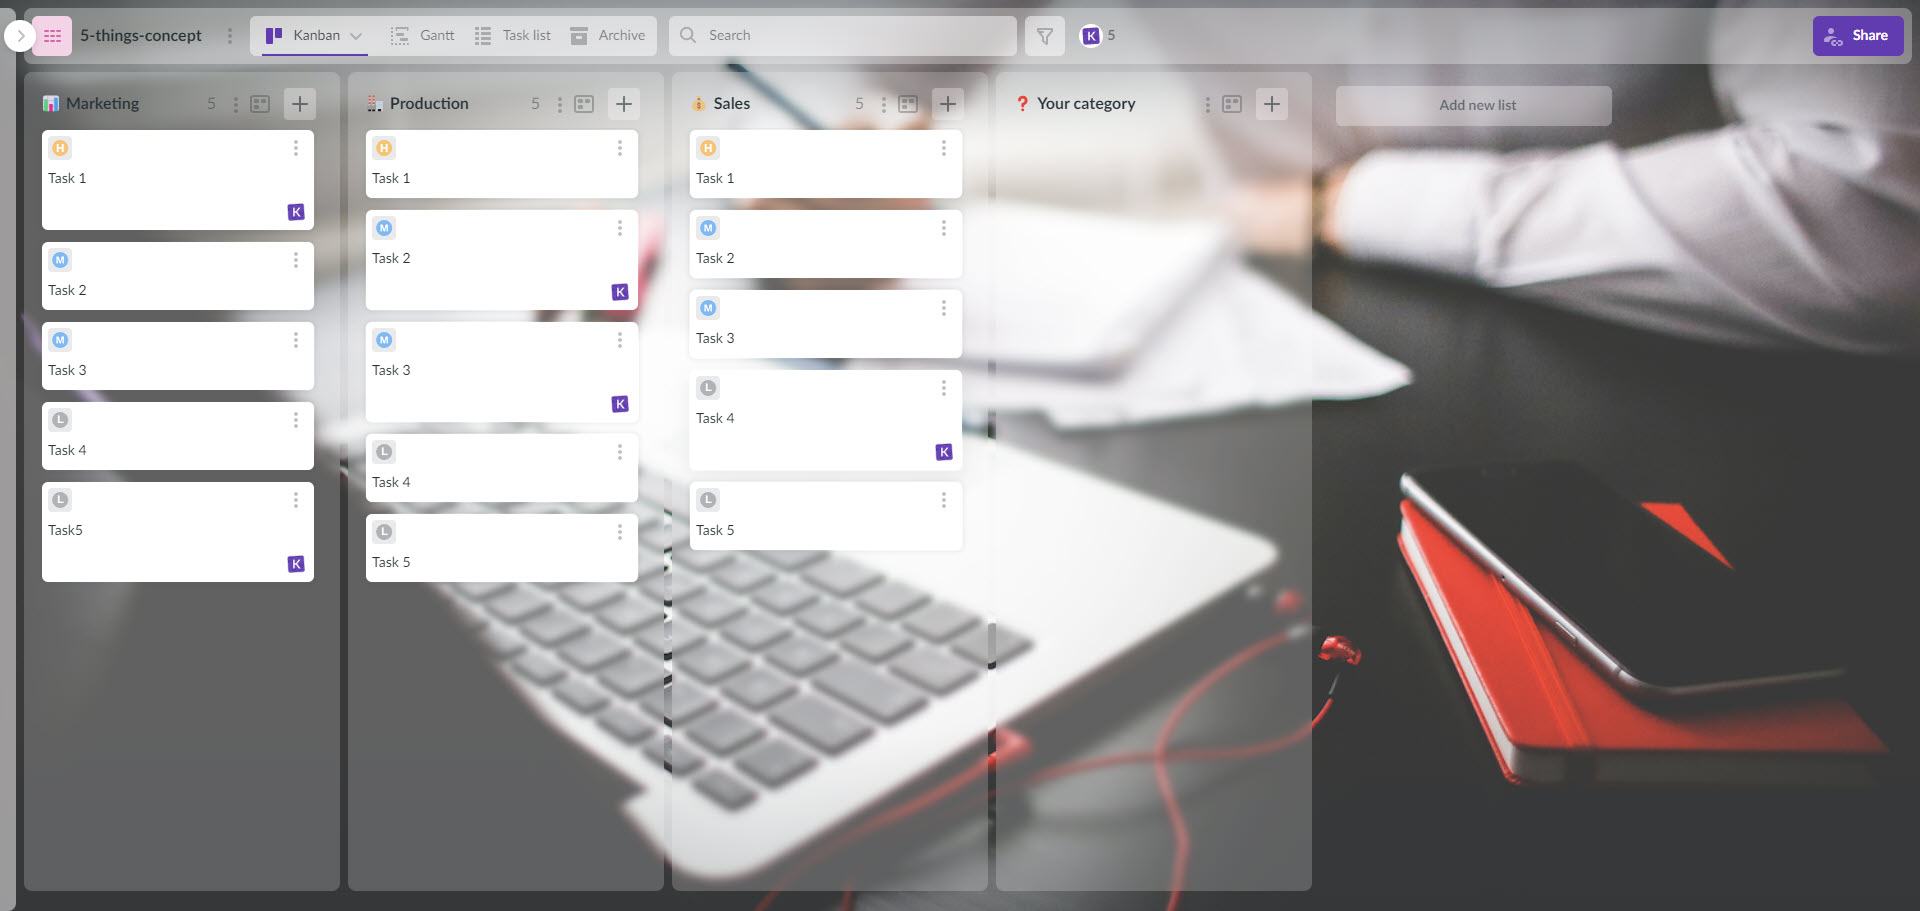
Tasks split into three priority groups, high, medium, and low, with one rule: no team member holds more than five tasks at a time.
The rule is the template. Five is arbitrary, but the limit is not, because a person holding twelve tasks is not working on twelve tasks; they are working on one and worrying about eleven. Capping the number forces the prioritization conversation to happen when work is assigned rather than when a deadline is missed.
Expect resistance. Every team that adopts a card limit spends the first fortnight arguing that their work is the exception. The limit works anyway.
Boards That Run on a Cycle
Some work is not a project with an end. It repeats weekly, monthly, or quarterly, and the board needs to reflect the cycle rather than a finish line.
Weekly Planning

Plan the week’s tasks and track what actually got done. Designed to be reset and refilled every week rather than run continuously.
The value is in the comparison, not the planning. A board that shows Monday’s plan next to Friday’s reality tells you something no to-do list does: how much of a week you can actually commit. Most people overcommit by roughly a third, consistently, and the only way to find out your own number is to look at four weeks of unfinished cards.
This one combines well with the 5 Things Concept. Plan the week, then cap what is in play on any given day.
Content Creation
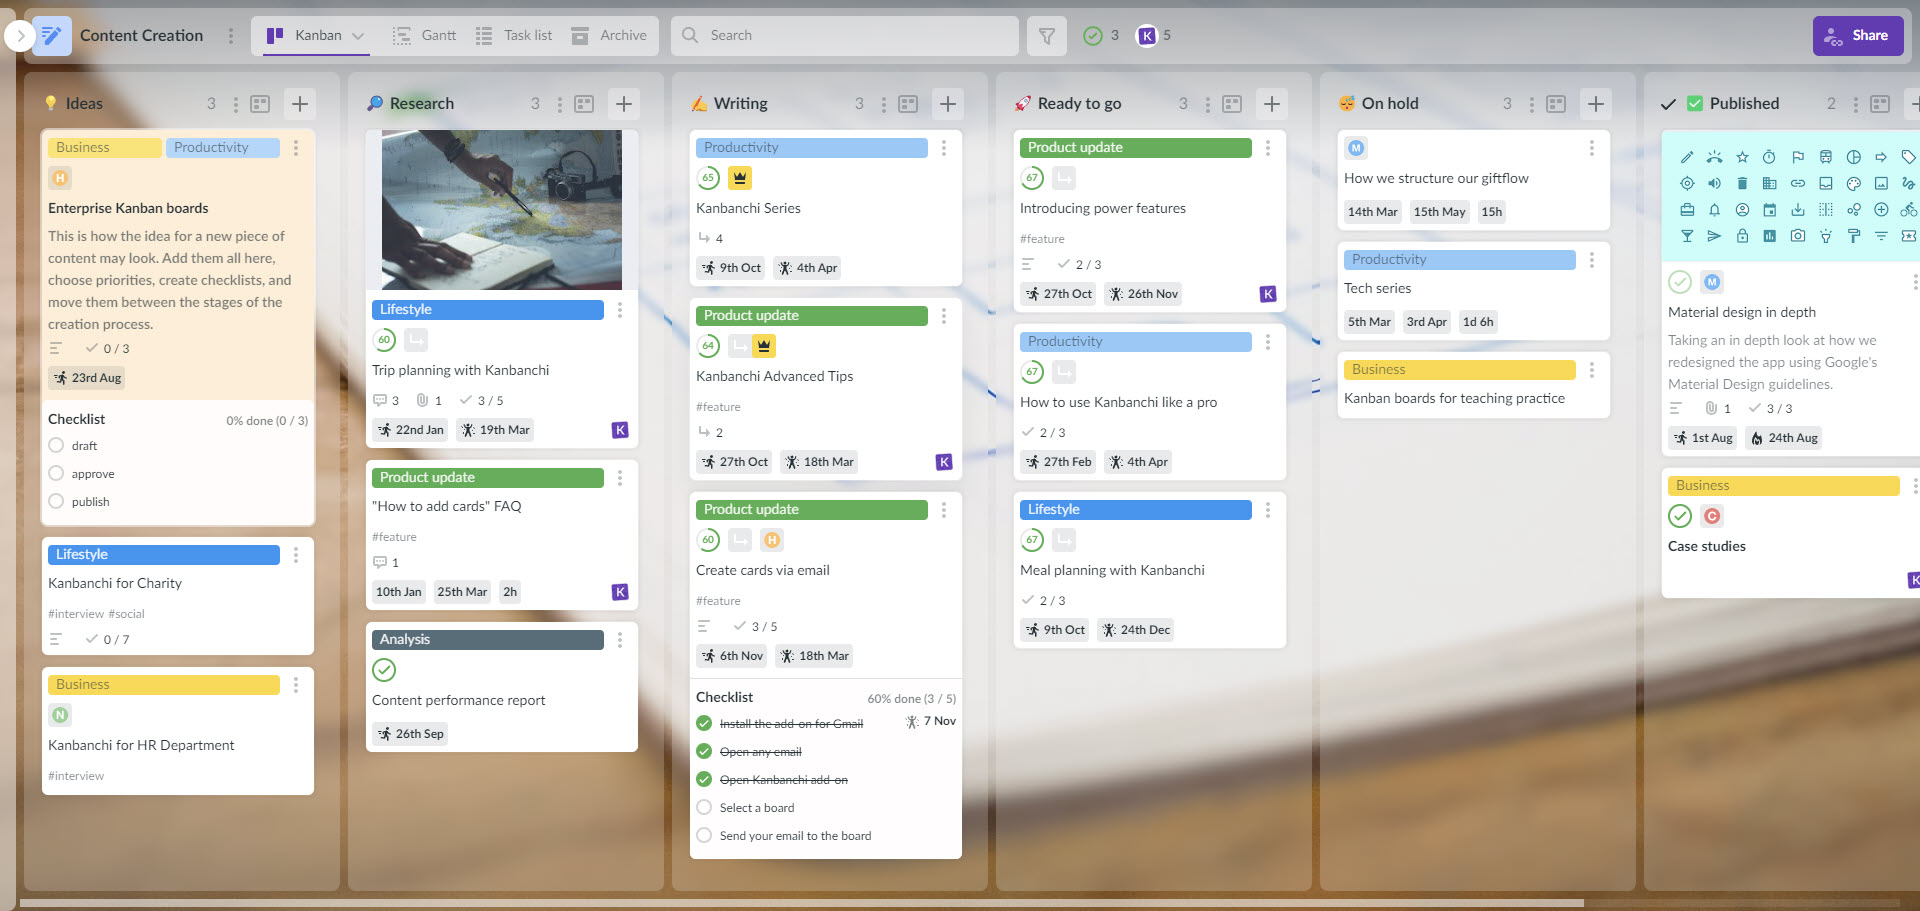
For teams publishing on a schedule. Plan what is being produced, see whose input each piece is waiting on, and track it through to publication.
Set up as a monthly board by default, though it converts easily to weekly or quarterly depending on your content calendar. The list that earns its place is whichever one represents review, because content almost never stalls in writing. It stalls waiting for somebody to approve it, and approval delay is invisible unless it is a stage with a name and an owner.
Boards for Software and Product Teams
Three templates for teams shipping software, each aimed at a different stage of a product’s life.
Agile Development
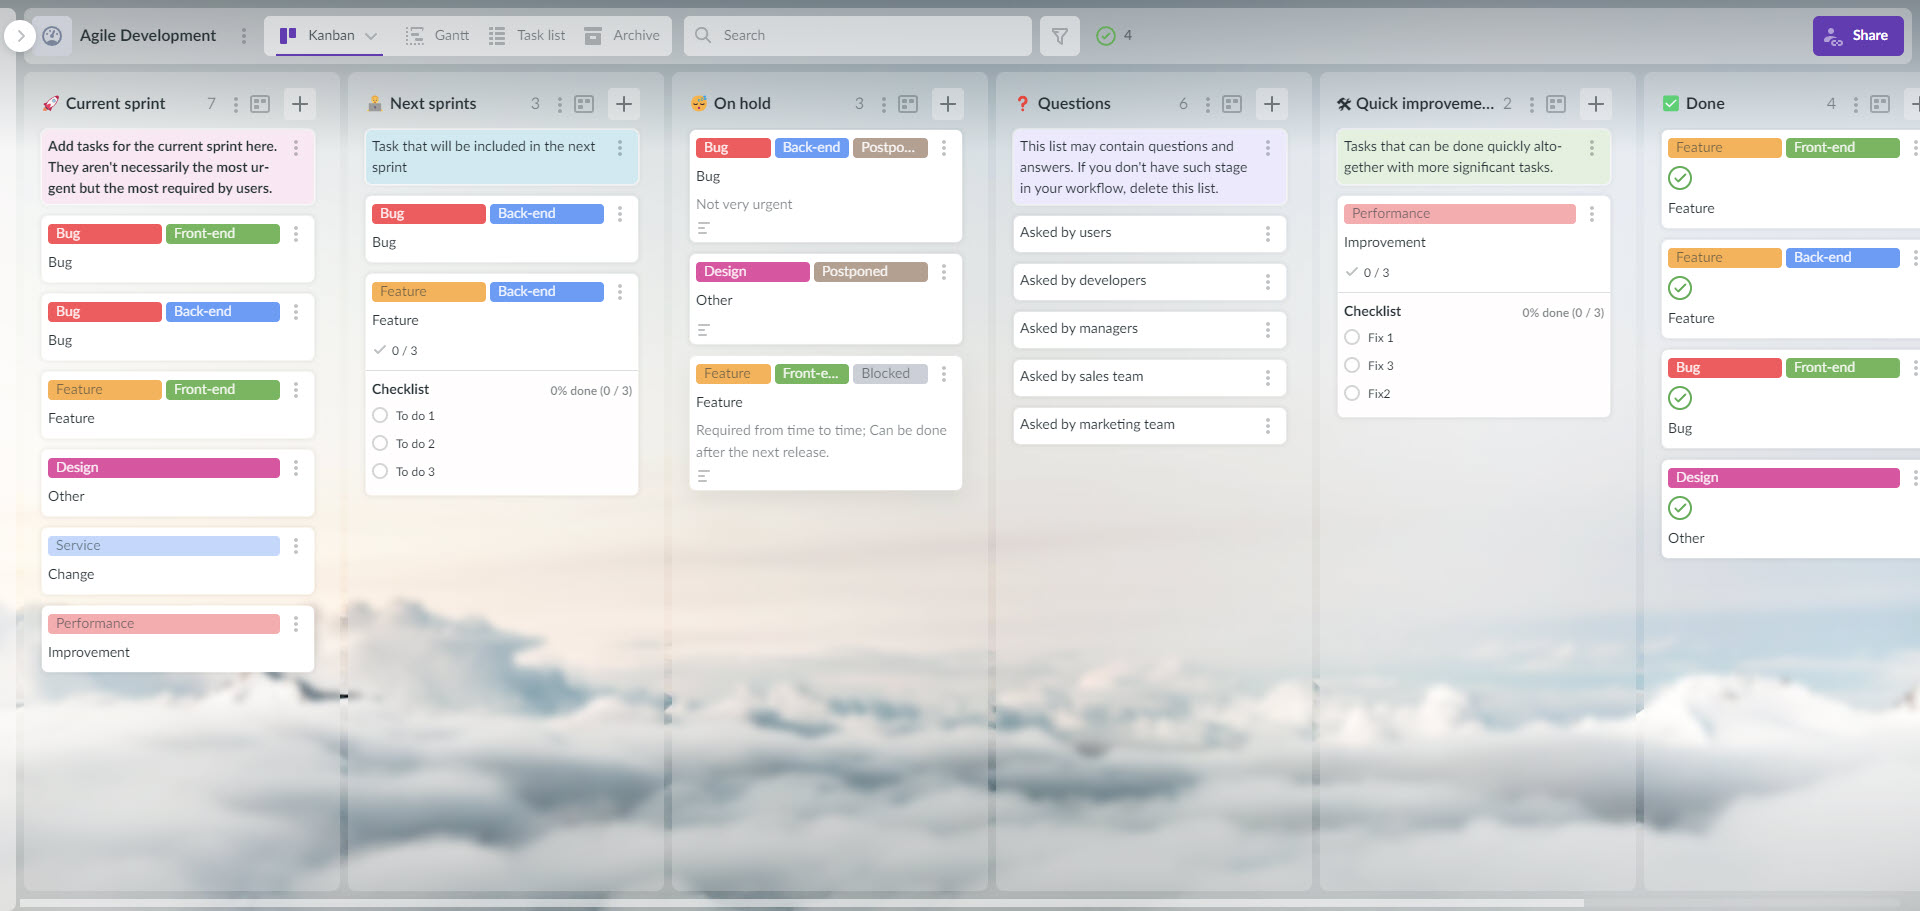
Built around an iterative development cycle, suited to small development teams rather than large multi-squad setups.
The honest scope: this handles the flow of work through an iteration. It is not a replacement for a dedicated issue tracker if your team lives in one, and it will not do sprint velocity math for you. What it does well is give a small team, or a team where developers and non-developers work together, one board everyone can read.
Product Development
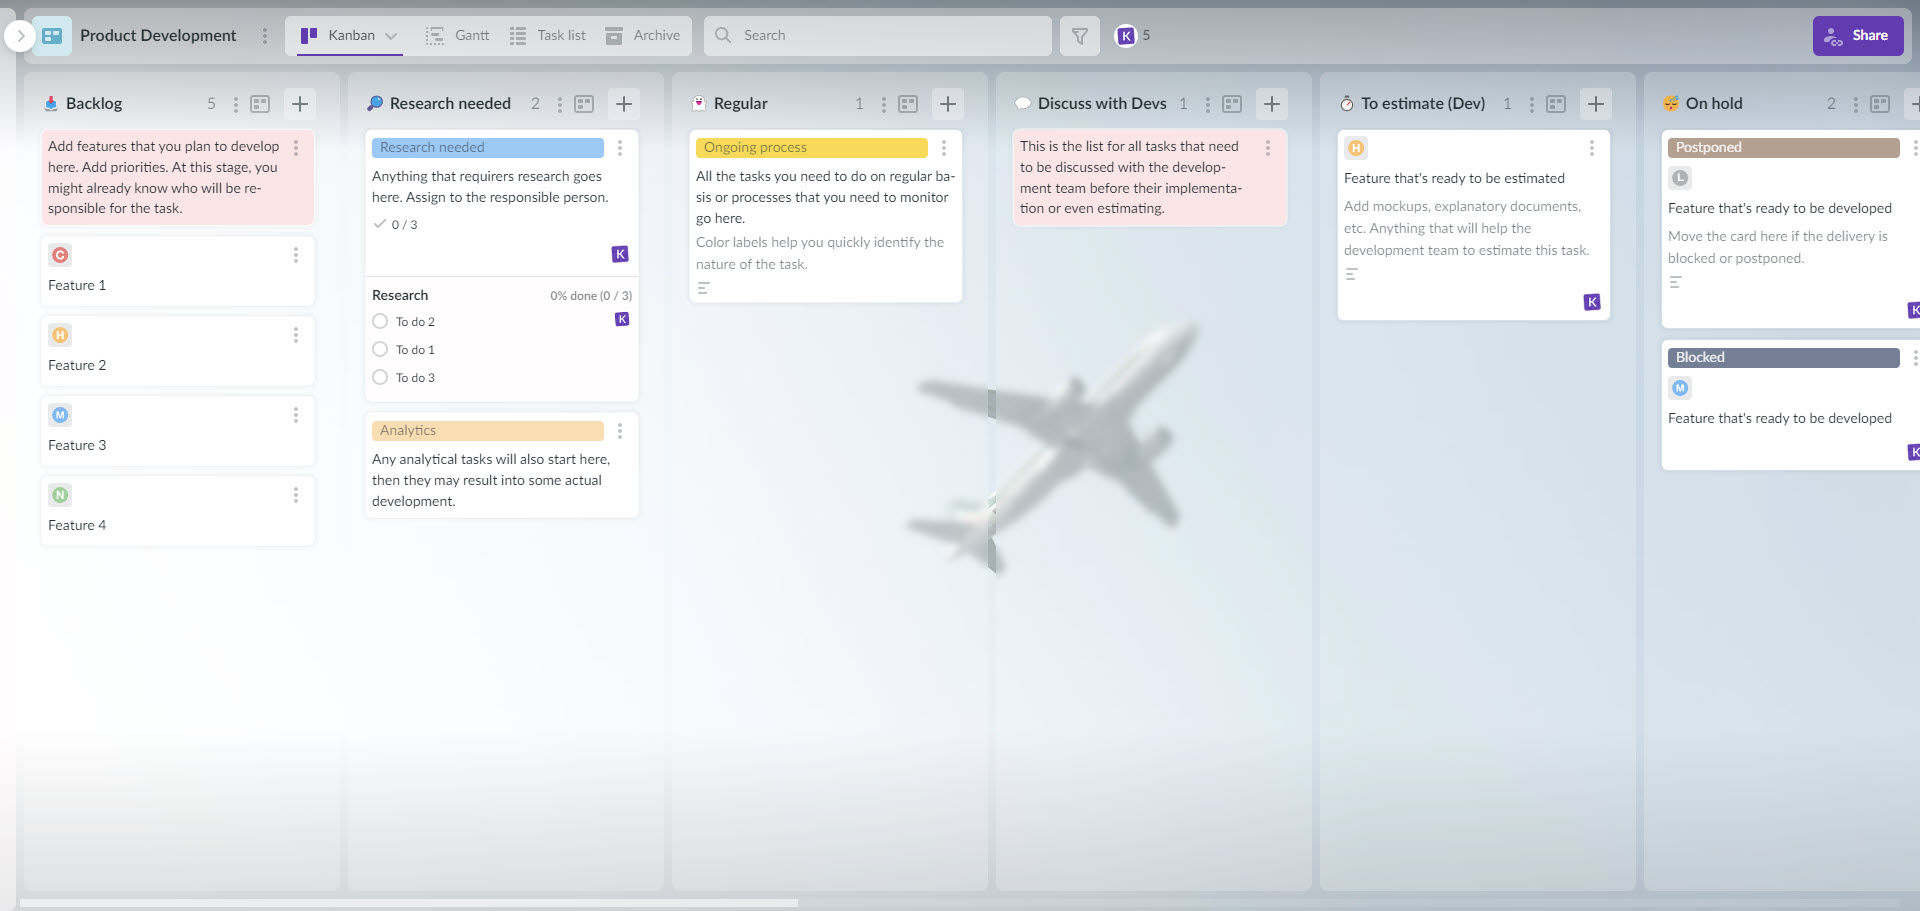
A product development and bug-fixing workflow built for remote teams.
The distinction from the Agile template is that this one is continuous rather than iterative. Bugs do not arrive in sprints. They arrive whenever, need triaging, and half of them turn out to be someone else’s problem. A board with an explicit triage stage stops the bug list from becoming a place where things go to be forgotten.
MVP Creation

Structures the process of getting a minimum viable product out, with the stages laid out so the sequence is visible.
The value here is mostly about what it forces you to leave out. An MVP board with defined stages makes scope creep a visible act: adding a card means putting it somewhere, and putting it somewhere means admitting it is before or after launch. Scope creep in a document is invisible. Scope creep on a board is a conversation.
Boards for a Specific Team or Project
Two templates for narrower situations, both worth knowing about because they solve problems the general-purpose boards handle badly.
Collaboration for Small Teams
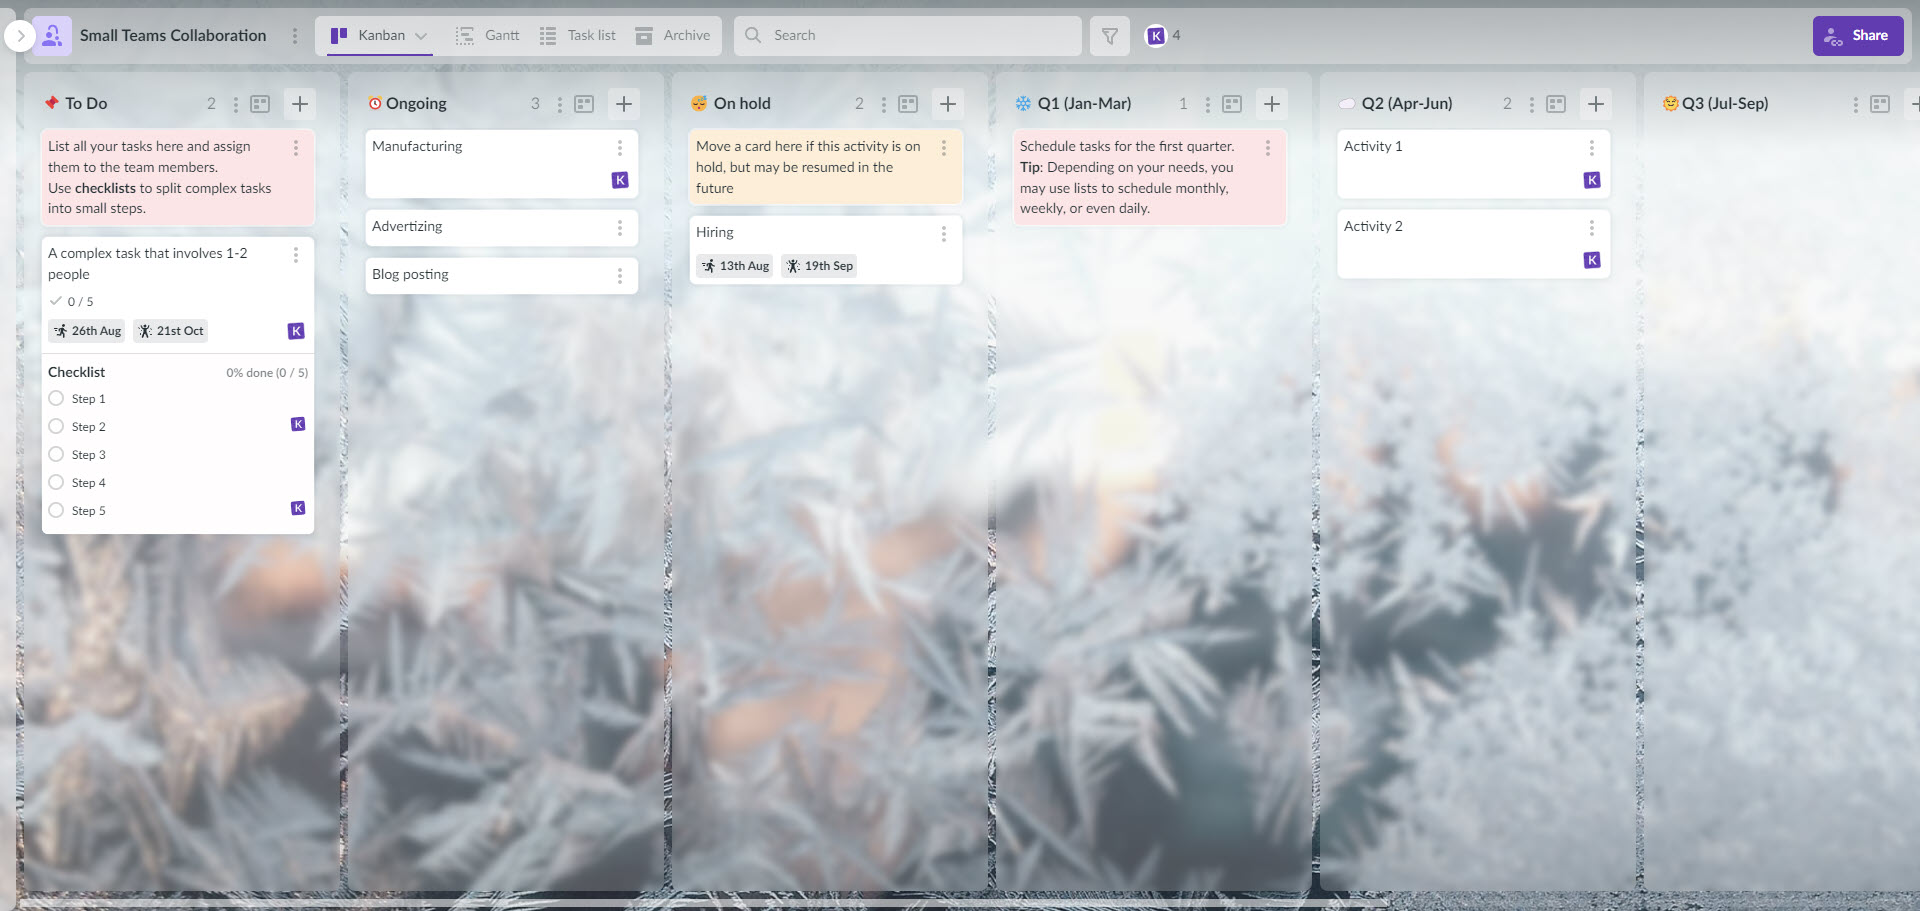
Built for teams of three to five people working online, and specifically for answering the question of what each person is working on right now.
That question sounds trivial and is the single most common reason small remote teams hold status meetings. When it is answerable by looking at a screen, a recurring meeting disappears. That is a real saving, and it is larger than the sum of the meeting slots, because the meeting was also fragmenting everyone’s afternoon.
Above five or six people, this stops scaling, and a workload view grouped by assignee works better.
Event Planning

For a conference, a launch event, or a single open-talk meeting. A finite project with a fixed date and a lot of parallel tracks.
Events are the clearest case for a board because the deadline is genuinely immovable and the work genuinely converges. Catering, speakers, venue, promotion, and registration all run in parallel and all have to be finished before the same morning. Seeing them on one timeline is the difference between finding out about the gap in week two and finding out in the final week.
Which Template Should You Start With?
| If your work is | Start with |
|---|---|
| Not tied to any specific process | Classic Kanban Template |
| The same as above, but with a big backlog | Kanban with Priorities |
| Spread too thin across too many tasks | 5 Things Concept |
| Planned and reset every week | Weekly Planning |
| Published on a schedule | Content Production |
| Shipping software in iterations | Agile |
| Fixing bugs continuously | Development |
| Getting a first version out | MVP Creation |
| A small remote team needing visibility | Collaboration for Small Teams |
| One event with a fixed date | Event Planning |
The general advice is to take the simplest one that fits and add to it. Teams that start with the most detailed template usually end up with three lists nobody uses and two they invented themselves.
Create a trial account to check templates
Adding the Numbers: Reports and Charts
Once the board is genuinely being used, the metrics become worth having. In that order, because numbers built on a board nobody updates are decoration.
Kanbanchi generates charts from your board data directly, with no export step. That covers the metrics most teams actually check, and it has one advantage over a spreadsheet: it cannot go stale, because it reads the live board rather than a copy of it.
For anything the built-in charts do not cover, board data exports to Google Sheets, and from there you can build whatever your reporting needs. Doing it in Sheets rather than a dedicated analytics tool has the practical benefit that everyone on the team can already open it, and nobody has to learn anything.
One caution. Four charts is a dashboard. Twelve is a wall. Pick metrics that would change a decision if they moved and delete the rest. How long work waits in each stage is actionable. Total cards completed is a number you already knew.
Making a Board That Survives Contact With a Team
The layout is the easy part. Three habits decide whether the board is still in use in March.
It has to be the only place. A board plus a spreadsheet plus a chat thread is not a dashboard; it is three sources of truth, and the forecast comes from whichever one somebody checked last.
Updating has to be cheaper than not updating. If keeping the board current takes ten minutes a day, it will be current for two weeks. If the board is where the work happens, it stays current because staying current is how the work gets done.
Somebody has to own the layout. Not the work, the layout. Boards drift, lists accumulate, and six months later there are fourteen columns and nobody remembers what two of them are for. One person deciding what the board looks like prevents that.
Frequently Asked Questions
What is a productivity dashboard?
A productivity dashboard is a single screen showing the current state of a person’s or a team’s work, so anyone can read status without asking. Some are visual, showing tasks and owners on a board. Others are metric-based, showing charts of throughput and time. Most teams need the visual one first, because the metric one is only as accurate as whatever feeds it.
What should a productivity dashboard include?
Work in progress with named owners, blocked items marked visibly, what is due this week, what is waiting on somebody outside the team, and recent completions. Five categories. Anything that will not change somebody’s next decision belongs in a report instead.
Can you build a productivity dashboard in Google Sheets?
Yes, and it works well for the metrics half. The limitation is that a spreadsheet does not update itself, so one person ends up maintaining it and eventually stops. The usual approach is to run day-to-day work somewhere it updates as a side effect of doing the work, then export to Sheets for the charts.
What is the difference between a dashboard and a Kanban board?
A kanban board is a specific kind of visual dashboard: columns as workflow stages, cards as work items, moved left to right as work progresses. Dashboard is the broader term and often means a metrics view instead. The word gets used loosely across the whole category, which is why searching for one returns both.
How many templates should a team use?
One per distinct process, and fewer than most teams think. A board per project plus a personal board for each person covers the majority of cases. Teams with eleven boards usually have three processes and eight abandoned experiments.
Helping leverage Kanbanchi for effective team collaboration. Specializing in educational institutions and non-profit organizations. Heading HR at Kanbanchi. Non-profit/Edu expert and HR head at Kanbanchi with over a decade experience Helping leverage Kanbanchi for effective team collaboration. Specializing in educational institutions and non-profit organizations. Heading HR at Kanbanchi.MultipleAuthors\Classes\Objects\Author Object
(
[term_id] => 924
[term:MultipleAuthors\Classes\Objects\Author:private] =>
[metaCache:MultipleAuthors\Classes\Objects\Author:private] => Array
(
[user_email] => yana.ramazanova@kanbanchi.com
[user_id] => 5
[first_name] => Yana R
[last_name] =>
[job_title] => Non-profit/Edu expert and HR head at Kanbanchi with over a decade experience
[description] =>
[80] =>
[50] =>
)
)