On Twitter last night, I came across something fascinating, via Maria at Brainpickings. (Always a source of fascinating bits.) It was an amazing visualization of the interactions of characters in the Iliad, and how they change throughout the book, by Argentinian designer Santiago Ortiz.
Do click here to view the stream in all its interactive glory. And then click on “network” for a different view. Mind-boggling.
I thought immediately of another graphic. A very low-tech graphic, in comparison, but one not entirely different. Remember the chart that Mr. T made last year, during his own fascination with The Iliad? It’s a chart of the various gods in The Iliad and how they interact with one another.

The thinking behind the two charts is quite similar, don’t you think? (You can see a bigger version here.)
Then there was this other chart which I’ve shared with you, about Avengers characters and how their “interestingness” changes over the course of the series. (Bigger, clickable version here.)
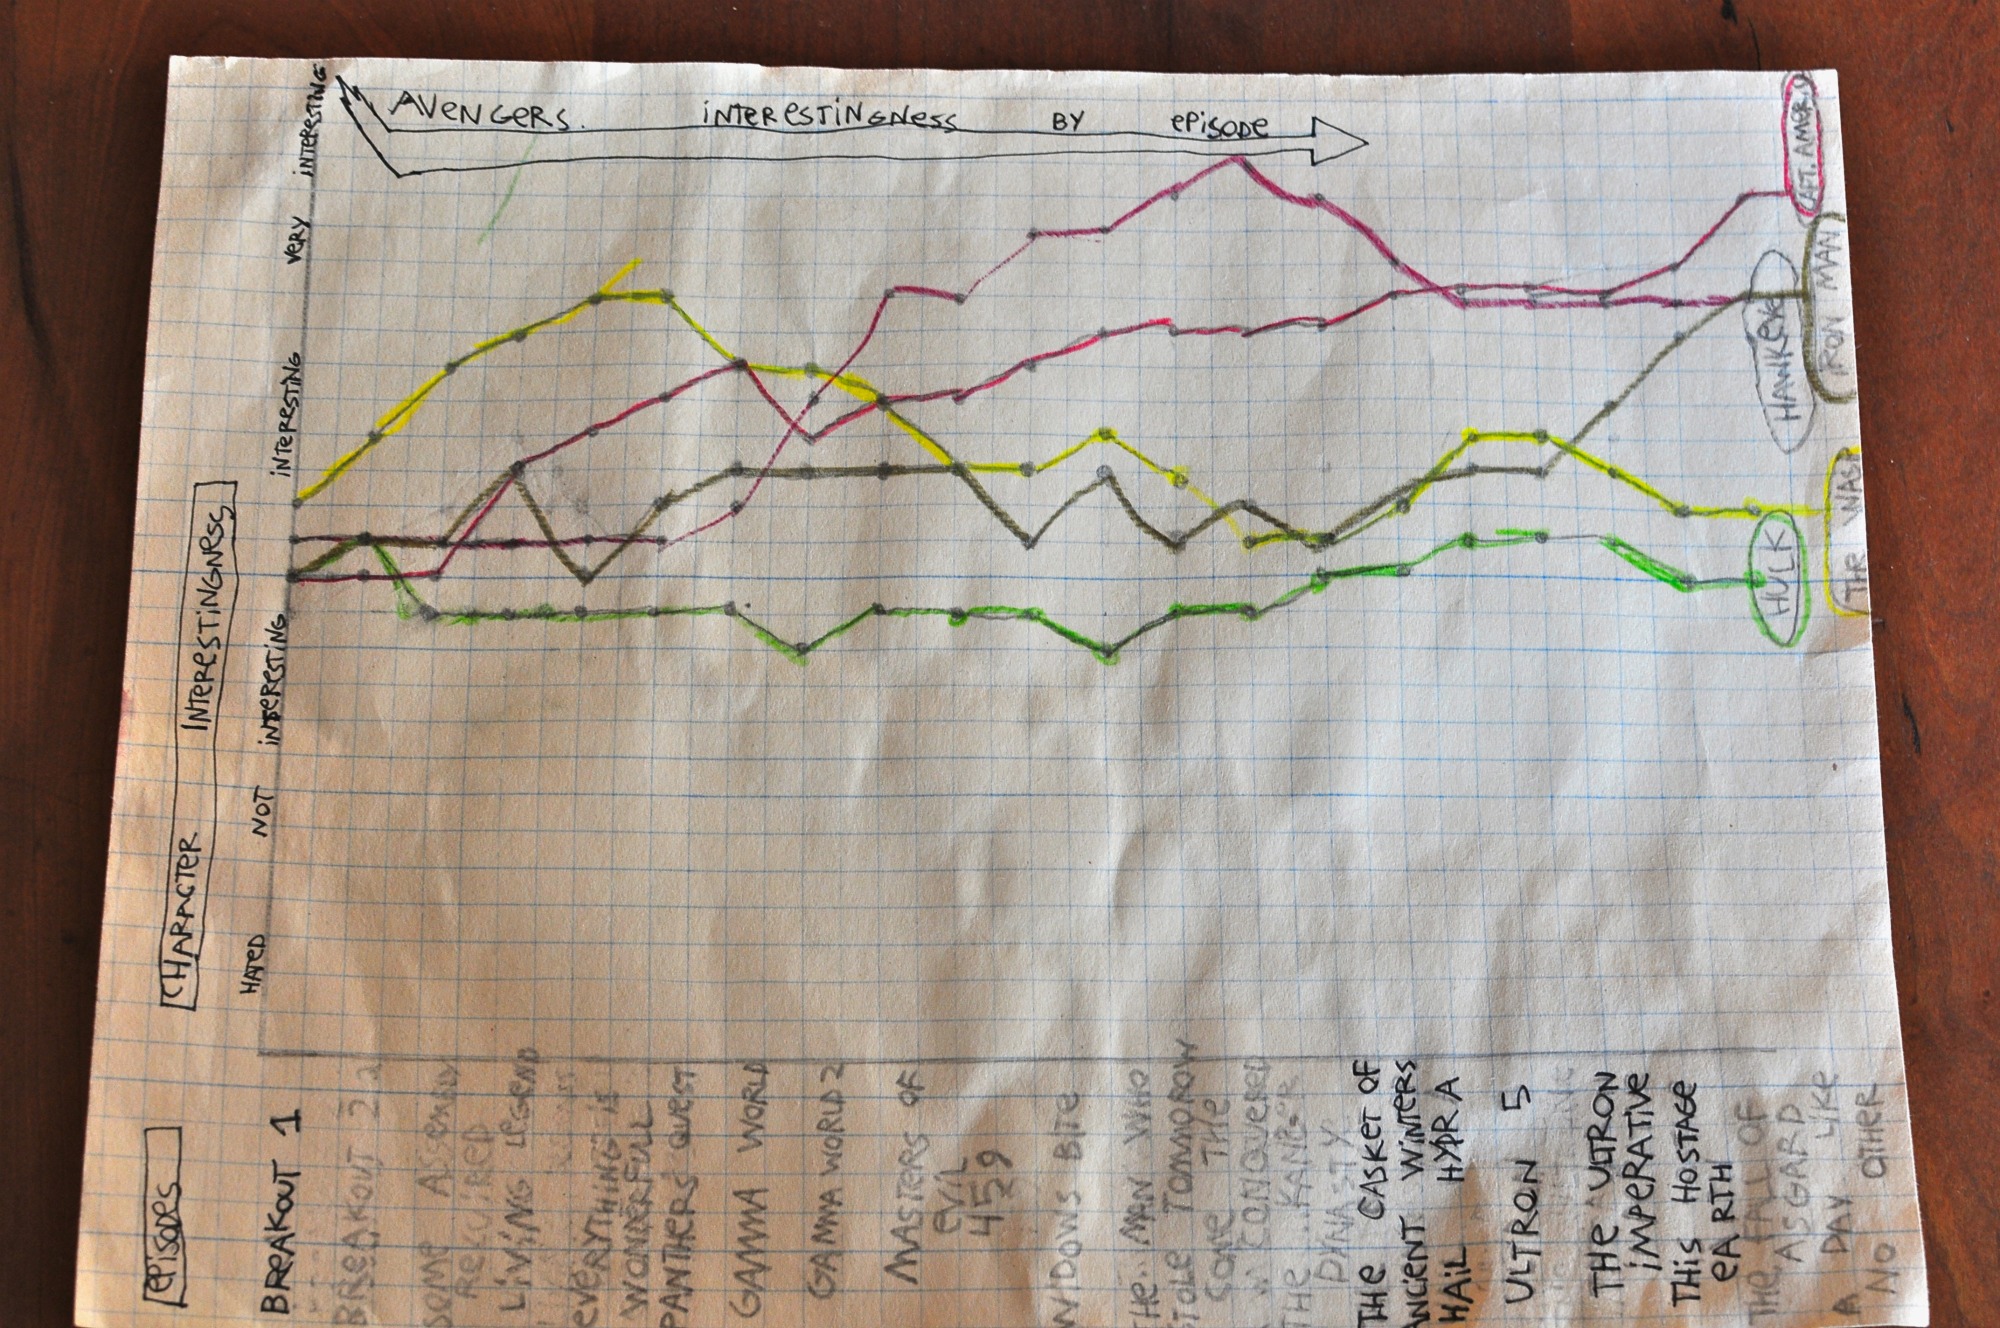

What’s compelling to me is that T came up with these ideas on his own. Sure, I’ve shown him lots of graphs and charts and encouraged him to think about sharing his ideas graphically. But he’s considered what he’s taking in (everything from classic literature to a superhero series–not so different in this case) and decided how to interpret it.
Mostly he’s just having fun. But look at how closely his play is connected to Santiago Ortiz’ work! A year ago, I didn’t even know there was such a job as visualization designer. I hadn’t heard the word infographic. But this is the stuff of the future. All the more reason not to dismiss the likes of video games and time spent at the computer. You never know where that might take kids.
More evidence of how the world is changing? As soon as I saw Santiago’s work, I wanted to contact him and share Mr. T’s work. I had a feeling he’d appreciate it. T, of course, found Santiago’s work fascinating. I contacted Santiago via email, but then we continued our conversation on Twitter. Little tweets flying back and forth between California and Argentina. Now my kid has a visual designer to follow–and a whole new future career to consider.
In her fantastic book Now You See It: How the Brain Science of Attention Will Transform the Way We Live, Work, and Learn, Cathy Davidson writes,
“By one estimate, 65 percent of children entering grade school this year will end up working in careers that haven’t even been invented yet.” (p. 18)
How do we prepare our kids for that? I think all we can do is nurture our kids’ fascinations, watch the world as it changes and look for connections between the two.
At least we don’t have to design a graphic visualization of those connections. But maybe our kids will.
(Edited to add: if you’re here via Jer Thorpe’s website, hello! You might be interested in the follow-up post that tells a bit more about Mr. T’s interactions with Jer.)