Have you ever had a memory instantiation problem that was impossible to track down? Here is a post that might help you with that kind of thing!
Beware! This post is very long… but VERY instructive! If you want to learn some internal mechanism of Flash, I strongly suggest you read it from top to bottom without skipping parts!:)
After finding what it was, we can conclude that this is not a real leak but a irritating behaviour of the Flash VM. Still, you should all be aware of it!
The Context
Yesterday I was helping Luca (creator of Nape physic engine, made with haXe) to find what seemed to be a big memory leak. There was a couple framework used so it could be directly from Nape… or from Starling… or from debug tool running… or from a port error from haXe…
So I though it was going to be simple
I got TheMiner running and started profiling. It was pretty easy to find a LOT of memory allocation coming from Starling. The SWC version available is over 4 months old and back then there was a lot of useless instantiation coming from TouchProcessor.as
If you use Starling, I suggest you build from sources as these instantiation are gone now.
There are a couple left but no big deal.
We also saw that Nape was using a LOT of anonymous function call and some try catch. This create what’s called activation-object. And there was a lot of these. So by removing anon-calls and try catch we were able to remove a lot of instanciation.
And After removing the debugging tools, It was clear it was coming from haXe or Nape.
But even when recording all samples allocated by the VM I could not find the damn allocation. (we are talking of more than 1Mo per sec)
Then I wrote a Scala script to try to identify samples that could have been missed, but that didn’t help me much since that was only an override of constructor and constructorProp avm opcodes.
Simplifying the context
So I decided to look a bit further into the bytecode and found something very interesting.
After simplifying the problem multiple time, I got this very simple code to demonstrate the bug.
Because Nape has that very nice abstraction layer, it can support both standard DisplayObject as well as Starling 3D DisplayObject.
The leak happens when Nape try to set the DisplayObject properties like .x, .y, .rotation, etc.
Let’s create a fake DisplayObject class and name it DO
public class DO
{
	public var x:Number;
	public var y:Number;

	public function DO() { }
}
And now, a simple loop that set .x and .y values on that DisplayObject, and on a UnTyped object representing the abstraction layer.
public class MainBug extends Sprite {
	public var mAnonDO:*;
	public var mDO:DO;
	public function MainBug():void {
			mDO = new DO();
			mAnonDO = mDO;
			addEventListener(Event.ENTER_FRAME, update);
		}
		public function update(ev:Event):void {
			var j:Number = 234.3948;
			for (var i:int = 0; i < 1000; i++) {
			mDO.x     = j; // <-- memory is flat
			mAnonDO.y = j; // <-- causes memory to explode
		}
	}
}
So basicly we have the same DO Object in memory, and we access it via a Typed or an UnTyped variable.
When accessing it with the Typed on, nothing happens, The memory is not impacted at all.
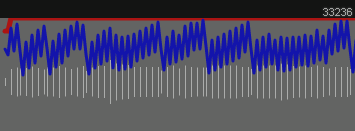
But when accessing through the Anonymous Object, BAM, 1 Mo/sec. wtf?
The ByteCode:
So let’s take a look at the bytecode generated for this loop in the update() function:
while(int1 < 1000)
{
	    #16   label

	    #18   getlocal0
	    #19   getproperty  mDO
	    #20   getlocal2
	    #21   setproperty  x
	this.mDO.x = number1;

	    #23   getlocal0
	    #24   getproperty  mAnonDO
	    #25   getlocal2
	    #26   setproperty  y
	this.mAnonDO.y = number1;

	    #28   getlocal3
	    #29   increment_i
	    #30   convert_i
	    #31   setlocal3
	int1 = int(int1) + 1;
}
I don’t know if you see any difference between the Anonymous function and the strickly typed one, but for me they look pretty much the same! getlocal0, getProp, getlocal2, setProp.
Again, when we comment out “this.mDO.x = number1;“, there is a lot of memory allocation, and when we comment out the other one “this.mAnonDO.y = number1;” there is zero allocation.
A strange behaviour
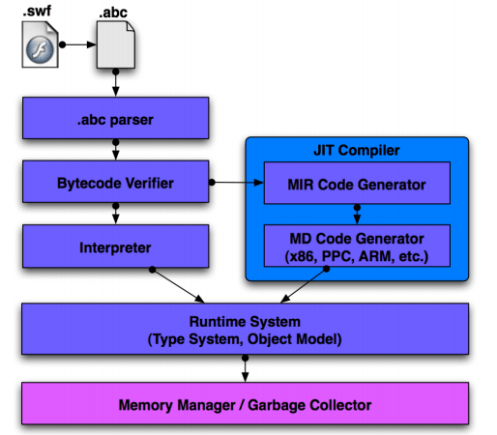
So if it’s not in the opcodes… it’s deeper! For those who have read the AVM2 Architecture documentation, you might remember that after the opcodes there are still a big phase to go through: The JIT, including Intermediate representation, and Machine Code Assembly.
Intermediate representation (MIR)
As demonstrated in the graph, the intermediate representation is part of the JIT.
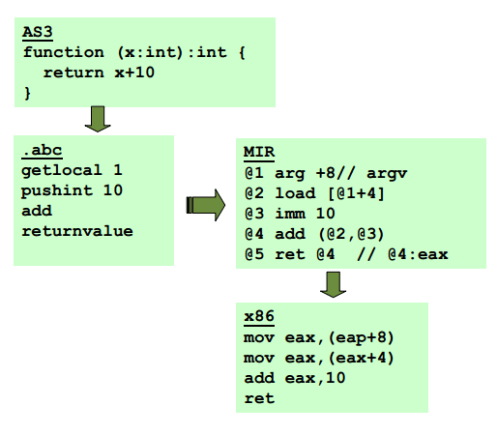
And it looks pretty much like this:

When the abc is ready to be processed, the JIT compiles it in the MIR, and then the result is process for your specific machine (Win32, MAX, Linux, etc.) in a Machine Dependant Code.
To find that damn memory leak, I had to output that MIR code.
Digging deeper (The MIR)!
So I decided to go back in time to an old post I made about tracing Assembly data generated by the JIT: Flash Assembler (not ByteCode) : And you thought it couldn’t get faster/
I don’t use this function a lot nowadays because it has been removed from all FlashPlayer build since Flash 10.1
But it is possible to output it in old version of the player!
Here is the output for the strictly typed part:
40:getlocal0
	@83 use   @16 [0]
		stack: MainBug?@83
		locals: MainBug?@83 flash.events::Event?@21 Number@60 int@67
41:getproperty mDO
	cse   @75
	@84 ucmp  @83 @75
	@85 jeq   @84 -> 0
	@86 ld    132(@83)
		stack: DO?@86
		locals: MainBug@83 flash.events::Event?@21 Number@60 int@67
43:getlocal2
	@87 fuse  @60 [2]
		stack: DO?@86 Number@87
		locals: MainBug@83 flash.events::Event?@21 Number@87 int@67
44:setproperty x
	cse   @75
	@88 ucmp  @86 @75
	@89 jeq   @88 -> 0
	@90 st    24(@86) <- @87
		stack:
		locals: MainBug@83 flash.events::Event?@21 Number@87 int@67
And here is the output for the not strictly typed part:
48:getlocal0
	 @94 use   @16 [0]
		 stack: MainBug@94
		 locals: MainBug@94 flash.events::Event?@21 Number@60 int@67
 49:getproperty mAnonDO
	 @95 ld    128(@94)
		 stack: *@95
		 locals: MainBug@94 flash.events::Event?@21 Number@60 int@67
 51:getlocal2
	 @96 fuse  @60 [2]
		 stack: *@95 Number@96
		 locals: MainBug@94 flash.events::Event?@21 Number@96 int@67
 52:setproperty {MainBug,public,MainBug.as$29}::y
	 save state
	 @97 def   @95
	 @98 fdef  @96
	 @99 cm    MethodEnv::nullcheck (@3, @95)
	 set code context
	 @101 st    43382752(0) <- @3
	 set dxns addr
	 @102 ldop  0(@3)
	 @103 ldop  20(@102)
	 @104 lea   4(@103)
	 @105 st    43382076(0) <- @104
	 @106 fuse  @98 [6]
	 cse   @78
	 @107 cmop  AvmCore::doubleToAtom_sse2 (@78, @106)
	 init multiname
	 @109 alloc 16
	 @110 imm   16
	 @111 st    0(@109) <- @110
	 @112 imm   43427168
	 @113 st    4(@109) <- @112
	 @114 imm   44102088
	 @115 st    8(@109) <- @114
	 cse   @102
	 @116 ldop  8(@102)
	 @117 use   @97 [5]
	 @118 cmop  Toplevel::toVTable (@116, @117)
	 cse   @102
	 cse   @116
	 @120 lea   0(@109)
	 save state
	 @121 cm    Toplevel::setproperty (@116, @117, @120, @107, @118)
		 stack:
		 locals: MainBug@16 flash.events::Event?@21 Number@60 int@67
Whoa!!
What the hell is that!
It’s the same setproperty opcode, but with a LOT of things underneath…
The difference is really that one variable is strictly typed, and the other not.
We can see it on the Stack:
stack: DO?@86 Number@87
vs
stack: *@95 Number@96
No need to say that just by looking at the number of instructions, you KNOW it will be a lot slower.
But not only that.. you can see type validation, memory allocation ( @109 alloc 16 )
and even access to the VTable: @118 cmop Toplevel::toVTable (@116, @117)
So I though *bingo*, there is our allocation!
*sight*… It’s not over yet!
I knew that the memory growing was not a problem when using Int instead of Number.
So I tried to output the same MIR code for the Int test:
43:getlocal2
	@88 use   @62 [2]
		stack: *@87 int@88
		locals: Main@84 flash.events::Event?@21 int@88 int@69
44:setproperty {Main,.events:EventDispatcher}::x
	save state
	@89 def   @87
	@90 def   @88
	@91 cm    MethodEnv::nullcheck (@3, @87)
	set code context
	@93 st    39909344(0) <- @3
	set dxns addr
	@94 ldop  0(@3)
	@95 ldop  20(@94)
	@96 lea   4(@95)
	@97 st    39908668(0) <- @96
	@98 use   @90 [6]
	cse   @79
	@99 cmop  AvmCore::intToAtom (@79, @98)
	init multiname
	@101 alloc 16
	@102 imm   16
	@103 st    0(@101) <- @102
	@104 imm   39953728
	@105 st    4(@101) <- @104
	@106 imm   40632776
	@107 st    8(@101) <- @106
	cse   @94
	@108 ldop  8(@94)
	@109 use   @89 [5]
	@110 cmop  Toplevel::toVTable (@108, @109)
	cse   @94
	cse   @108
	@112 lea   0(@101)
Again…. it looks pretty much the same 😦
..So it’s not the Alloc from the MIR code that create the memory.
What difference is there left? Well on one side you have:
@99 cmop AvmCore::intToAtom (@79, @98)
and on the other side you have:
@107 cmop AvmCore::doubleToAtom_sse2 (@78, @106)
Could it be directly from Tamarin? Let’s open some code!
Digging even Deeper (Tamarin Core)!
Let’s start with intToAtom:
Atom AvmCore::intToAtom(int n)
{
	// handle integer values w/out allocation
	int i29 = n << 3;
	if ((i29>>3) == n)
	{
		return uint32(i29 | kIntegerType);;
	}
	else
	{
		return allocDouble(n);
	}
}
Interesting… I always like the feeling of viewing Alloc in a line of code.
So I remembered that Int atom was encoded with only 29 bits for the value. I changed my test and instead of
var j:int = 234;
I used
var j:int = int.MAX_VALUE;
and BAM AGAIN!
memory growing like crazy.
Ok so I guess we are getting a lot closer to the source now.
Here is the doubleToAtom_sse2 function:
doubleToAtom_sse2 is defined in the AvmCore.cpp class from Tamarin
Atom AvmCore::doubleToAtom_sse2(double n)
{
	 int id3;
	 _asm {
			 movsd xmm0,n
			 cvttsd2si ecx,xmm0
			 shl ecx,3               // id<<3
			 mov eax,ecx
			 sar ecx,3               // id>>3
			 cvtsi2sd xmm1,ecx
			 ucomisd xmm0,xmm1
			 jne d2a_alloc   // < or >
			 jp  d2a_alloc   // unordered
			 mov id3,eax
	}

	if (id3 != 0 || !MathUtils::isNegZero(n))
	{
		 return id3 | kIntegerType;
	}
	else
	{
		 _asm d2a_alloc:
		 return allocDouble(n);
	}
}
Again, you can see the allocDouble in there.
But you can also see the return integer Atom part!
Again I forgot about that! dynamic type switching from int to number.. but also from number to int!
I re-wrote the test to use
var j:Number = 234.3948;
and used
var j:Number = 234;
And… here we go again… zero instantiation!
I guess the only thing left to look at is the allocDouble() function right?
Here it is:
Atom allocDouble(double n)
{
	double *ptr = (double*)GetGC()->Alloc(sizeof(double), 0);
	*ptr = n;
	return kDoubleType | (uintptr)ptr;
}
Oh my! look at that! A call to allocate the memory for a double!
Conclusion
At runtime, when you use anonymous object, the JIT have no idea of what type it is, and when you need to set the property on one of these object, it need to validate the objects, and instantiate a new Atom to copy the values.
It’s not the case when you use strictly typed object because when it’s ready to set the value, it just does!
When putting all the elements together you get this ridiculous code:
var anon:*;
for (var i:int = 0; i < 100000; i++) {
	anon = 3.3;
}
This will allocate memory like crazy. (100000 * sizeof(double) )
If you think this is a bug, vote for it
Solutions?
I didn’t find any great way to solve this problem except from using strictly typed object.
Going back to Nape, it means that it cannot use the abstraction layer like it was designed.
The only way is to expose a generic management for classic displayobject, and overridable functions to give the possibility to an external framework (like Starling) to do updates of properties in a strictly typed way.
References:
Frameworks:
http://starling-framework.org/
https://github.com/PrimaryFeather/Starling-Framework/blob/master/starling/src/starling/events/TouchProcessor.as
http://code.google.com/p/nape/
Tool:
http://code.google.com/p/apparat/
http://www.sociodox.com/theminer/
Docs:
http://www.adobe.com/content/dam/Adobe/en/devnet/actionscript/articles/avm2overview.pdf
http://onflex.org/ACDS/AS3TuningInsideAVM2JIT.pdf
http://zenit.senecac.on.ca/wiki/dxr/source.cgi/mozilla/js/tamarin/core/AvmCore.cpp
http://zenit.senecac.on.ca/wiki/dxr/source.cgi/mozilla/js/tamarin/core/AvmCore.h


