Effective tax rates paid by 50 largest companies in S&P 500
The year has ended and tax season is right around the corner (January at time of writing this). So, I thought what better way to mark the occasion than to do a quick pull to see what the largest public companies are paying in taxes. I did a quick scrape of tax rates on Reuters for the 50 largest companies by market cap in the S&P 500, pulling both the 5 year average and trailing 12 month tax rates.
After pulling the data, I first split the tax rates out by sector, as shown below:
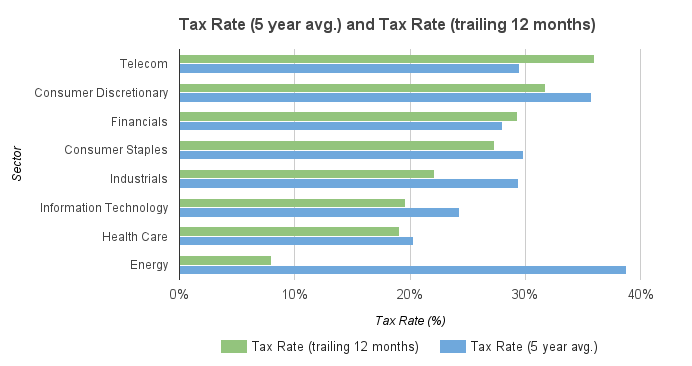
Here, we can see that on average over the past 5 years (blue bar) Healthcare and IT pay the least taxes, while Energy normally pays the most. However, since the price of oil kind of crashed, Energy companies are now (unsurprisingly) bottoming out the list for the trailing 12 month tax rate.
Tax rates for the 50 largest companies in the S&P 500 (5 year average and trailing 12 months):
| Ticker | Company Name | Tax Rate (5 year avg.) | Tax Rate (trailing 12 months) | Sector | Industry | Rank |
|---|---|---|---|---|---|---|
| AMGN | Amgen Inc | 10% | 14% | Health Care | Biotechnology | 1 |
| CELG | Celgene Corp | 14% | 19% | Health Care | Biotechnology | 2 |
| BMY | Bristol-Myers Squibb Co | 16% | 23% | Health Care | Pharmaceuticals | 3 |
| ABBV | AbbVie Inc | 17% | 22% | Health Care | Biotechnology | 4 |
| QCOM | QUALCOMM Inc. | 17% | 17% | Information Technology | Semiconductors & Semiconductor Equipment | 5 |
| CSCO | Cisco Systems Inc | 17% | 17% | Information Technology | Communications Equipment | 6 |
| MDT | Medtronic PLC | 19% | 6% | Health Care | Health Care Equipment & Supplies | 7 |
| GOOG | Alphabet Inc. | 19% | 15% | Information Technology | Internet Software & Services | 8 |
| JNJ | Johnson & Johnson | 19% | 17% | Health Care | Pharmaceuticals | 9 |
| GILD | Gilead Sciences Inc | 20% | 19% | Health Care | Biotechnology | 10 |
| VZ | Verizon Communications Inc | 21% | 36% | Telecommunication Services | Diversified Telecommunication Services | 11 |
| IBM | International Business Machines Corp | 21% | 5% | Information Technology | IT Services | 12 |
| BAC | Bank of America Corp | 21% | 31% | Financials | Banks | 13 |
| ORCL | Oracle Corp | 22% | 23% | Information Technology | Software | 14 |
| MSFT | Microsoft Corp | 22% | 15% | Information Technology | Software | 15 |
| NKE | Nike Inc | 23% | 16% | Consumer Discretionary | Textiles, Apparel & Luxury Goods | 16 |
| KO | Coca-Cola Co (The) | 24% | 21% | Consumer Staples | Beverages | 17 |
| PG | Procter & Gamble Co (The) | 24% | 25% | Consumer Staples | Household Products | 18 |
| MRK | Merck & Co Inc. | 24% | 19% | Health Care | Pharmaceuticals | 19 |
| INTC | Intel Corp | 25% | 19% | Information Technology | Semiconductors & Semiconductor Equipment | 20 |
| HON | Honeywell International Inc | 25% | 25% | Industrials | Industrial Conglomerates | 21 |
| PEP | PepsiCo Inc | 25% | 23% | Consumer Staples | Beverages | 22 |
| PFE | Pfizer Inc | 26% | 14% | Health Care | Pharmaceuticals | 23 |
| GE | General Electric Co | 26% | -8% | Industrials | Industrial Conglomerates | 24 |
| AAPL | Apple Inc | 26% | 26% | Information Technology | Technology Hardware, Storage & Peripherals | 25 |
| USB | U.S. Bancorp | 27% | 27% | Financials | Banks | 26 |
| V | Visa Inc | 27% | 25% | Information Technology | IT Services | 27 |
| BA | Boeing Co | 27% | 6% | Industrials | Aerospace & Defense | 28 |
| JPM | JPMorgan Chase & Co | 27% | 29% | Financials | Banks | 29 |
| UTX | United Technologies Corp | 28% | 32% | Industrials | Aerospace & Defense | 30 |
| MA | Mastercard Inc | 28% | 25% | Information Technology | IT Services | 31 |
| MMM | 3M Co | 29% | 28% | Industrials | Industrial Conglomerates | 32 |
| PM | Philip Morris International Inc | 29% | 27% | Consumer Staples | Tobacco | 33 |
| WBA | Walgreens Boots Alliance Inc | 30% | 20% | Consumer Staples | Food & Staples Retailing | 34 |
| C | Citigroup Inc | 30% | 30% | Financials | Banks | 35 |
| WFC | Wells Fargo & Co | 31% | 32% | Financials | Banks | 36 |
| GS | Goldman Sachs Group Inc (The) | 31% | 27% | Financials | Capital Markets | 37 |
| WMT | Wal-Mart Stores Inc | 32% | 28% | Consumer Staples | Food & Staples Retailing | 38 |
| MCD | McDonald's Corp | 32% | 31% | Consumer Discretionary | Hotels Restaurants & Leisure | 39 |
| T | AT&T Inc | 33% | 35% | Telecommunication Services | Diversified Telecommunication Services | 40 |
| UPS | United Parcel Service Inc | 34% | 34% | Industrials | Air Freight & Logistics | 41 |
| DIS | Walt Disney Co (The) | 34% | 34% | Consumer Discretionary | Media | 42 |
| CMCSA | Comcast Corp | 35% | 37% | Telecommunication Services | Diversified Telecommunication Services | 43 |
| MO | Altria Group Inc | 36% | 36% | Consumer Staples | Tobacco | 44 |
| HD | Home Depot Inc. (The) | 36% | 37% | Consumer Discretionary | Specialty Retail | 45 |
| UNH | Unitedhealth Group Inc | 39% | 41% | Health Care | Health Care Providers & Services | 46 |
| XOM | Exxon Mobil Corp | 39% | 8% | Energy | Oil, Gas & Consumable Fuels | 47 |
| CVS | CVS Health Corp | 39% | 39% | Consumer Staples | Food & Staples Retailing | 48 |
| FB | Facebook Inc | 43% | 29% | Information Technology | Internet Software & Services | 49 |
| AMZN | Amazon.com Inc | 58% | 40% | Consumer Discretionary | Internet & Direct Marketing Retail | 50 |
*Data scraped from Reuters Jan. 2017, excludes companies with negative net income