Hot on the heels of our release of the first 650,000 feature files as part of the first release of AcousticBrainz, we are presenting some initial findings based on this dataset.
We thank Emilia Gómez (@emiliagogu), an Associate Professor and Senior Researcher at the Music Technology Group at Universitat Pompeu Fabra for doing this analysis and sharing her results with us. All of these results are based on data automatically computed by our Essentia audio analysis system. Nothing was decided by people. Isn’t that cool?
The MTG recently started the AcousticBrainz http://acousticbrainz.org/ project, in collaboration with MusicBrainz. Data collection started on September 10th, 2014, and since then a total of 656,471 tracks (488,658 unique ones) have been described with essentia. I have been working for a while with audio descriptors and I followed the porting some of my algorithms to essentia, especially chroma features and key estimation. For that reason, I was curious to get a look this data. I present here some basic statistics. I computed them with the SPSS statistical software.
WHICH KIND OF MUSICAL GENRES DO WE HAVE IN THE COLLECTION?
In order to characterize this dataset, I first thought about genre. In essentia, there are four different genre models: trained on the data by Tzanetakis (2001), another one compiled at the MTG (Rosamerica), Dortmund and a database of Electronic music. Far from providing information on the kind of musical genres, these models seem to be contradictory! For example, in the Tzanetakis dataset “jazz” seems to be the most estimated genre, while the proportion of jazz excerpts is very small in the other models.
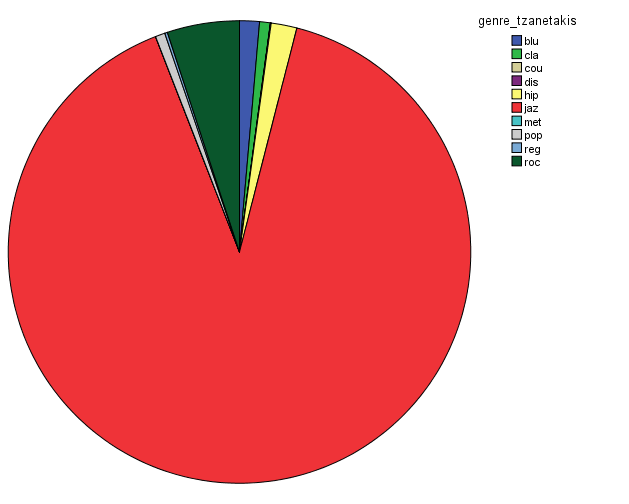
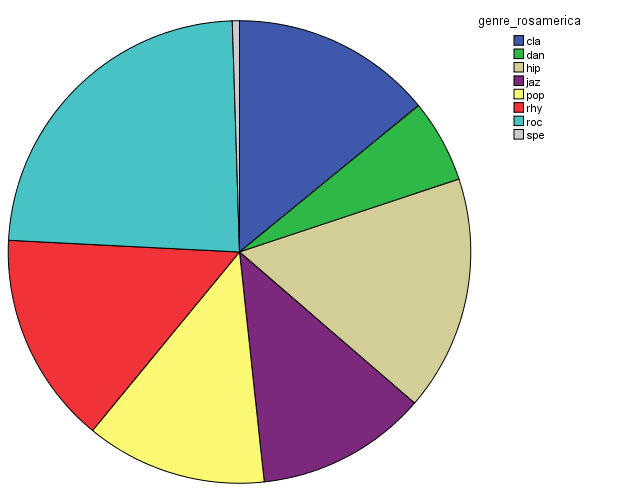
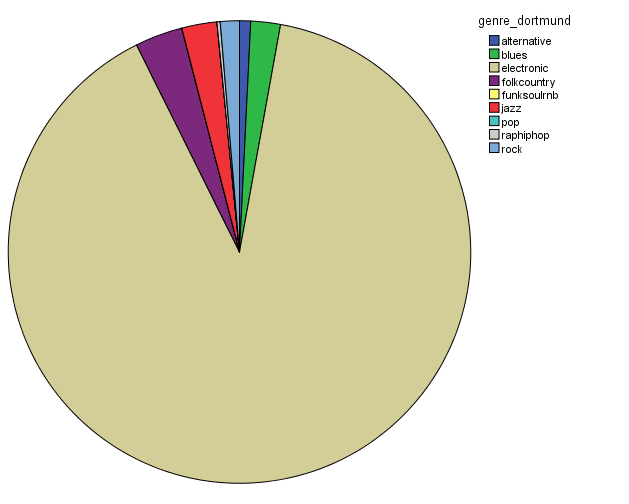
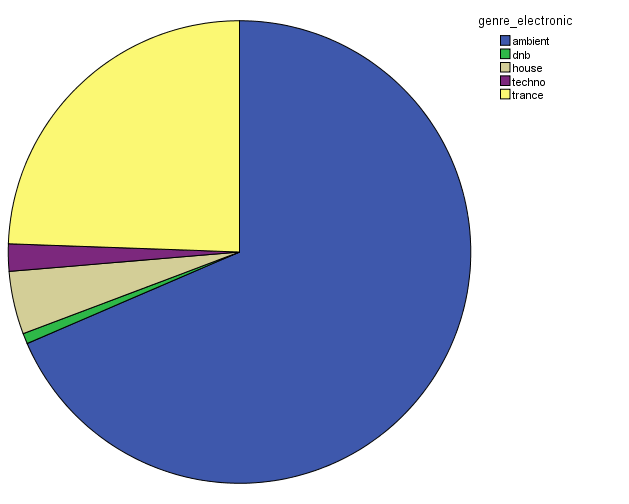
So in conclusion, we have a lot of jazz (according to the Tzanetakis dataset), electronic music (according to the Dortmund dataset), ambient (according to electronic dataset) and an equal distribution of all generes Rosamerica dataset (which does not include a category for electronic music)….Not very clarifying then! This is definitely something that we will be looking at in more depth.
WHAT ABOUT MOOD THEN?
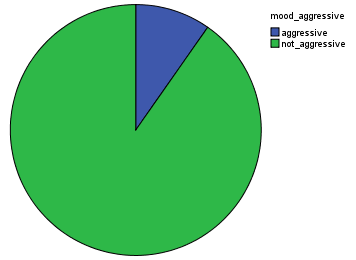
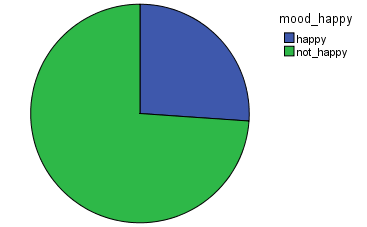
For Mood characterization, 5 different binary models were trained and computed on the dataset. We observe that there is a larger proportion of non-acoustic music, non-aggressive, and electronic. It is nice to see that most of the music is not happy and not sad! From this and previous study, I would then conclude that there is a tendency in the AcousticBrazinz dataset for electronic music.


The amount of electronic music (compare with the acoustic graph above)
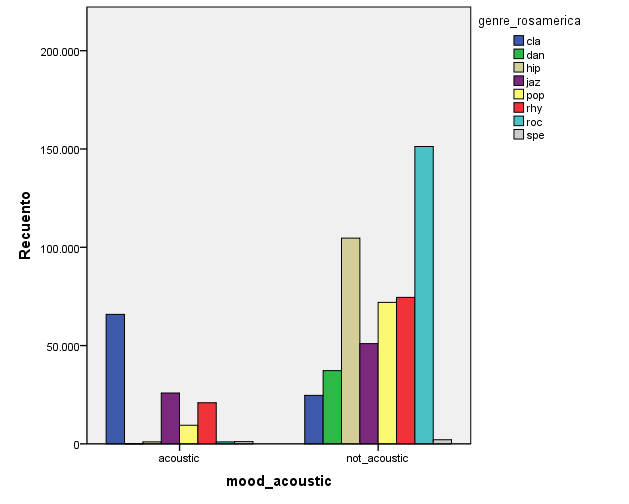
If we check for genre vs mood interactions, there are some interesting findings. We find that Classical is the most acoustic genre and rock is the least acoustic genre (due to its inclusion of electronic instruments):
HOW IS KEY ESTIMATION WORKING?
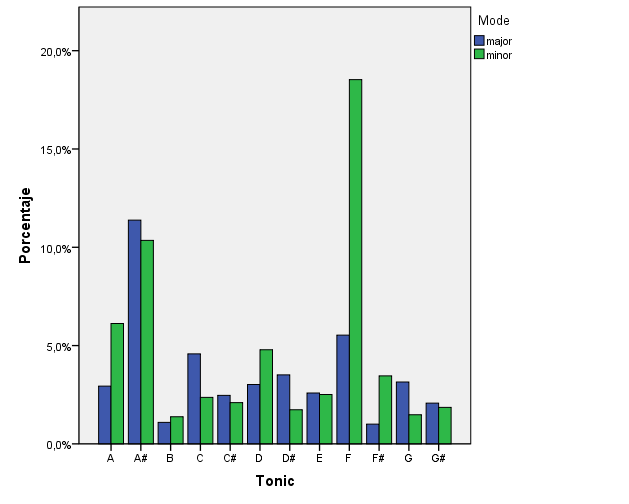
From a global statistical analysis, we observe that major and minor modes are both represented, and that the most frequent key is F minor / Ab Major or F# minor / A Major. This seems a little strange; A major and E major are very frequent keys in rock music. Maybe there are some issues with this data that need to be looked at.
IS THERE A LINK BETWEEN FEATURES AND GENRE?
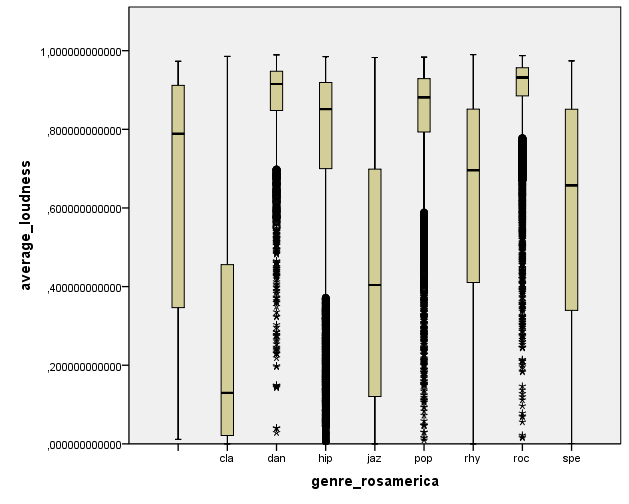
I wanted to do some plots on acoustic features vs genres. For example, we observe a small loudness level for classical (cla) music and jazz (jaz), and a high one for dance (dan), hip hop (hip), pop, and rock (roc).
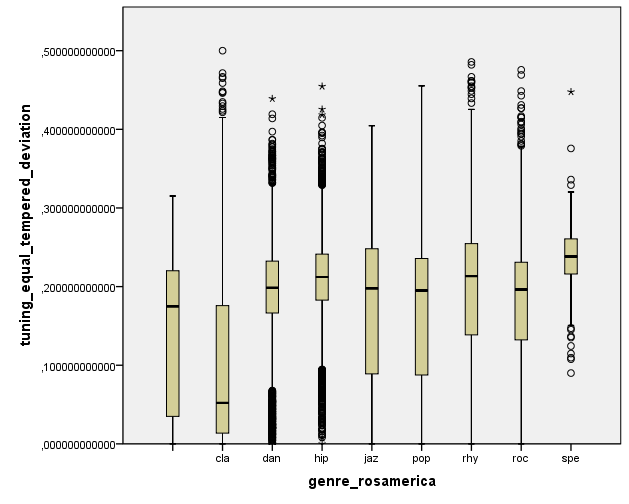
Finally, it is nice to see the relation between equal-tempered deviation and musical genre. This descriptor measures the deviation of spectral peaks with respect to equal-tempered tuning. It’s a very low-level feature but it seems to be related to genre. It is lower for classical music than for other musical genres.
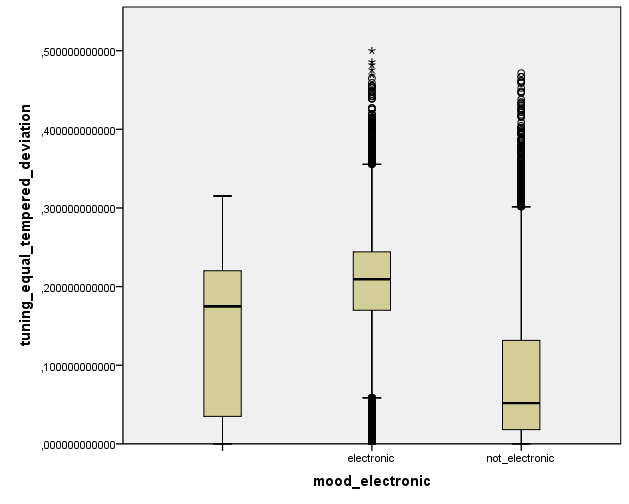
We also observe that for electronic music, equal tempered deviation is higher than for non-electronic music/acoustic music. What does this mean? In simple terms, it seems that electronic music tends to ignore the rules of what it means to be “in tune” more than what we might term “more traditional” music.
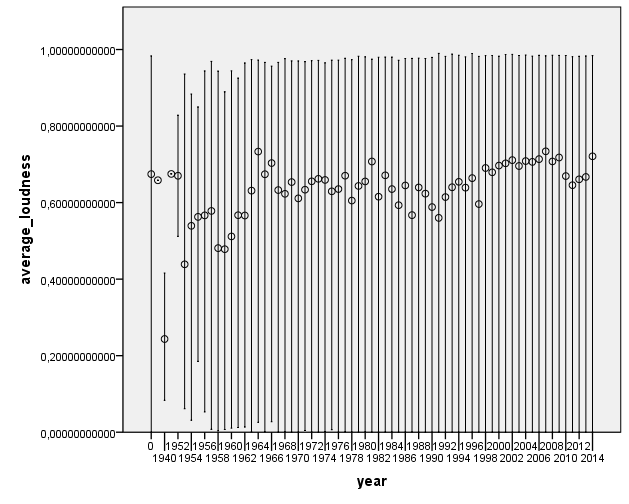
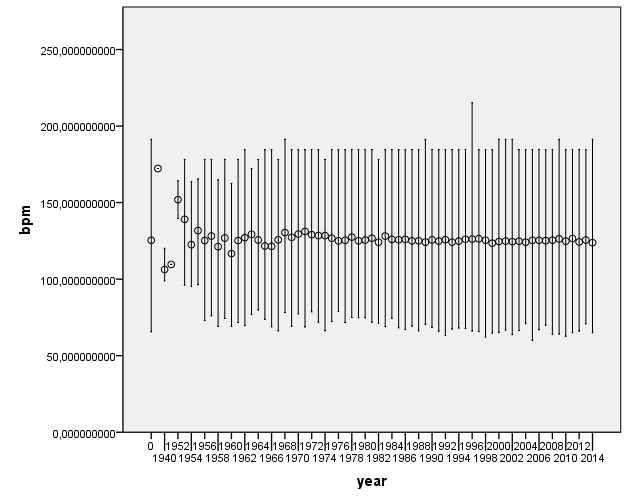
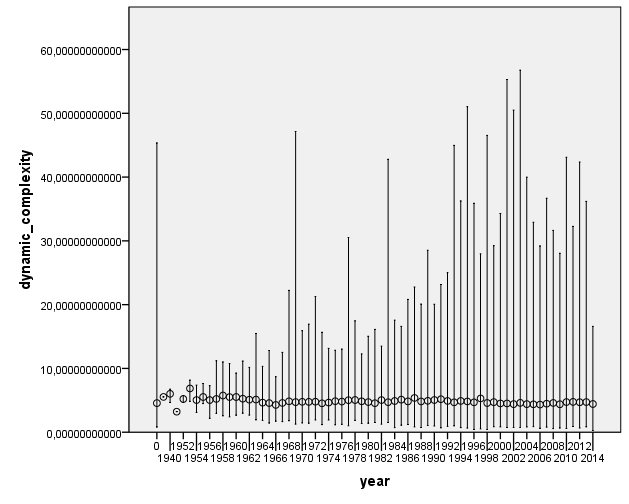
IS THERE A LINK BETWEEN FEATURES AND YEAR?
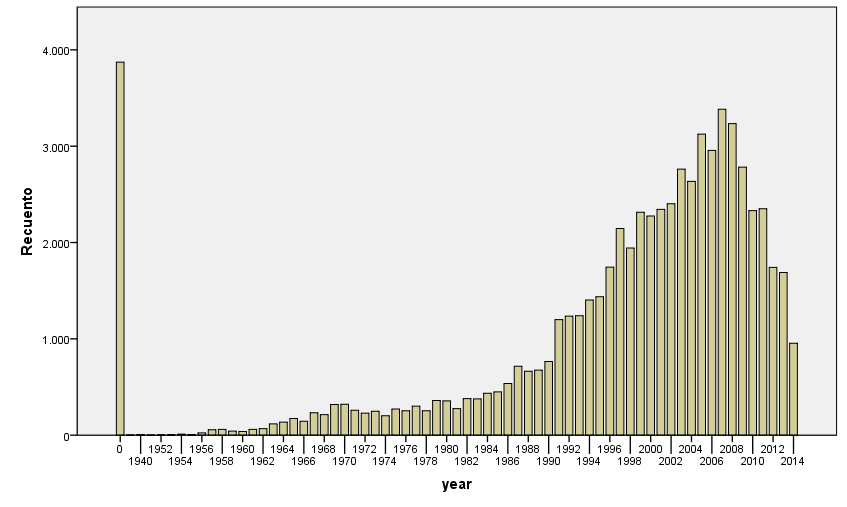
I was curious to check for historical evolution in some acoustic features. Here are some nice plots on the evolution of number of pieces per year, and some of the most relevant acoustic features. We first observe that most of the pieces belong to the period from 1990’s to nowadays. This may be an artifact of the people who have submitted data to AcousticBrainz, and also of the data that we find in MusicBrainz. We hope that this distribution will spread out as we get more and more tracks.
There does not seem to be a large change of acoustic features as year changes. This is definitely something to look into further to see if any of the changes are statistically significant.
We have many more ideas of ways to look at this data, and hope that it will show us some interesting things that we may not have guessed from just listening to it. If you would like to see any other statistics, please let us know! You can download the whole dataset to perform your own analysis at http://acousticbrainz.org/download